

Since 2008, only Sydney, Melbourne and Canberra have seen ‘real’ growth in dwelling values
The consumer price index (CPI) for June 2017 was released earlier this week showed that over the quarter headline inflation was recorded at 0.2% which took inflation to just 1.9% over the year to June 2017. Although annual headline CPI was temporarily within the Reserve Bank (RBA) target range of 2% to 3% over the March 2017, it has been below target for 10 of the past 11 quarters.

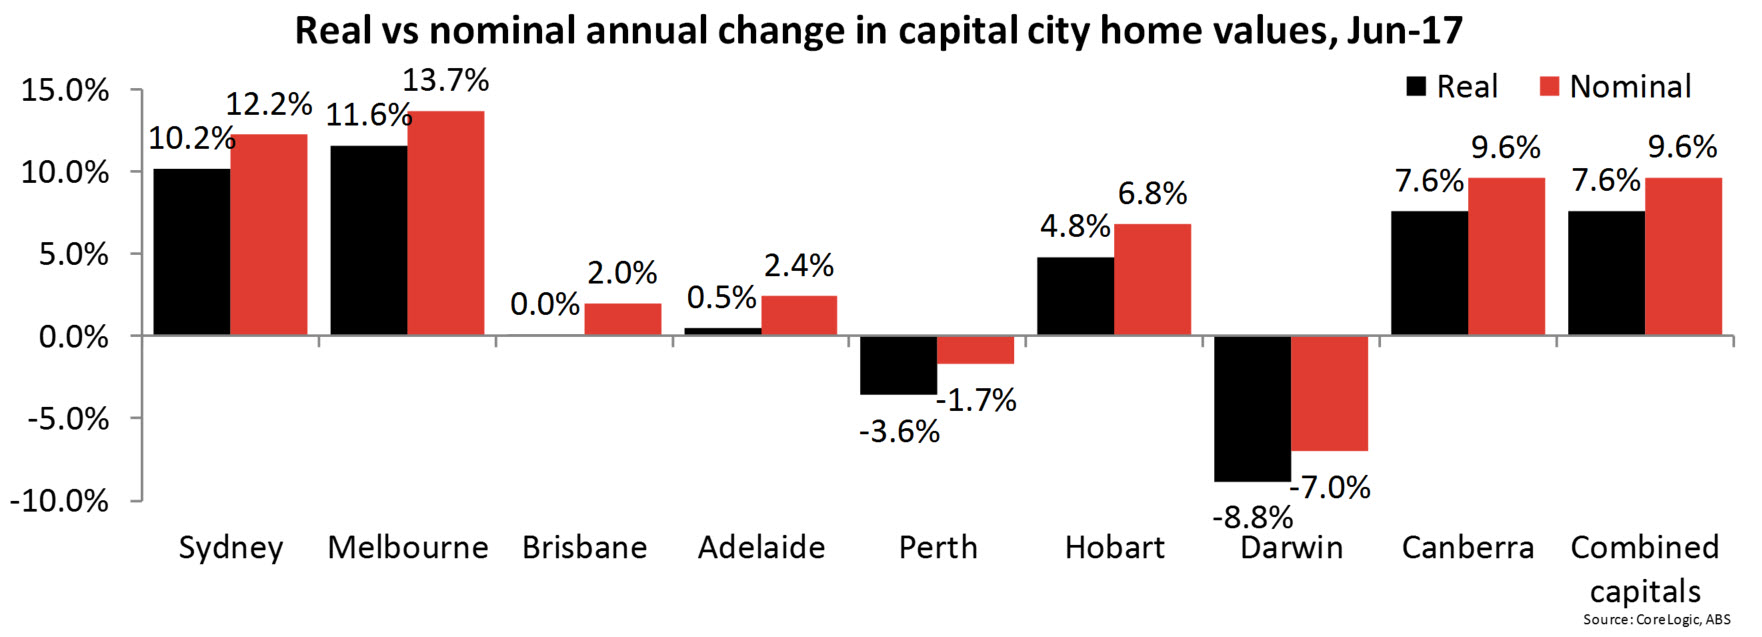
Adjusting dwelling value growth for inflation provides valuable insight into the housing market’s performance. With inflation currently at such a low level, adjusting for it is not resulting in any additional capital cities seeing value decline however, over the longer term it does highlight the significant under performance in terms of value growth for certain cities.

While in nominal terms capital city dwelling values declined in 2008 and then again in 2011-12, in real terms the declines were larger over these two periods and values also declined in 2004-05. In nominal terms, values fell by -6.1% between March and December of 2008 and by -6.4% between September 2010 and June 2012. In real terms, values fell by -2.6% between March 2004 and December 2005, by -8.3% between March and December 2008 and by -10.8% between September 2010 and December 2012.

Since the value declines ceased at the end of 2008, only Sydney, Melbourne and Canberra have actually recorded real growth in dwelling values. In all other cities, real dwelling values are currently lower than they were at the end of 2008 which is now almost nine years ago. This data really highlights the uneven nature of growth across the capital city housing markets since the end of the financial crisis. It also shows that low mortgage rates alone are not the driver of the much stronger growth in Sydney and Melbourne.

The above chart shows the change in real dwelling values across each capital city relative to their most recent market peaks. The chart again shows that values are only above their previous peak in Sydney, Melbourne and Canberra. Brisbane values are -9.3% lower than their peak in March 2008, Adelaide values peaked in June 2010 and are still -6.3% lower. In Perth, the market peak was September 2007 and values are still -20.0% off their peak and in Hobart values are -11.2% lower than their peak which occurred in December 2007. Finally, Darwin has seen the largest fall in real dwelling values, down -26.7% from its peak with the peak having occurred in September 2010.
The regularly reported nominal value data is valuable however, it is important and interesting to consider the impact of inflation on dwelling values from time-to-time. As the data shows, outside of Sydney and Melbourne and to a lesser degree Canberra, dwelling value growth has been extremely weak for a number of years now.
Source: CoreLogic Feed