The number of properties mortgaged is climbing however, values are increasing faster than outstanding debt
Earlier this week the Australian Bureau of Statistics (ABS) released its residential property prices indexes for the March 2017 quarter. A valuable data set from the release relates to the value of dwelling stock and the number of residential dwellings. Both of which have increased over the quarter. When this data is paired with data from the Australian Prudential Regulation Authority (APRA) and dwelling sales data there are some very valuable insights available into the housing market and lending from Australian authorised deposit-taking institutions (ADIs).

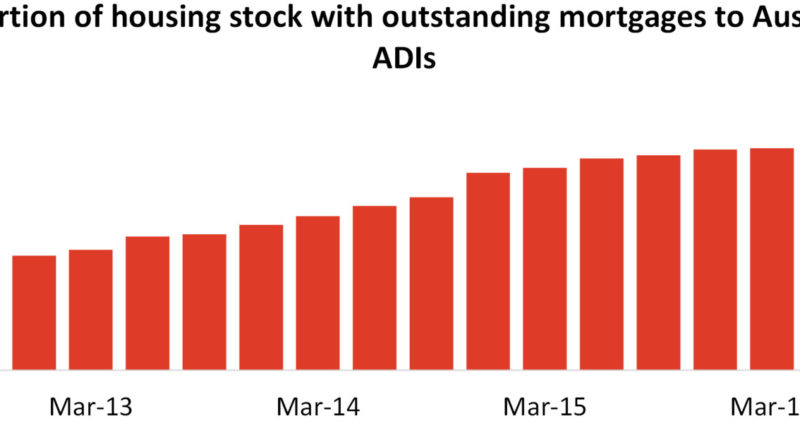
The chart above pairs the data on the number of dwellings nationally from the ABS with the number of outstanding mortgages to Australian ADIs from APRA. Based on these two datasets, 58.4% of total housing stock was mortgaged to an Australia ADI at the end of the March 2017 quarter. This figure had risen from 57.5% a year earlier and 50.0% a five years earlier. It is important to note this doesn’t mean that 41.6% of dwellings have no mortgage. Some of these properties will have mortgages with non-ADIs (an ADI is an institution which takes deposits) and some may also have mortgages to offshore banks, although the overall proportion in these two categories is likely to be quite low. Also recall that government owns a small proportion of residential properties in each state. The data highlights the proportion of dwellings that have a mortgage to a local ADI has been increasing however, a sizeable proportion of total housing stock is not an exposure for a local ADI.

The second chart pairs the total value of residential dwellings data from the ABS with data on the value of loans outstanding to Australia ADIs. The combination of these two data sets shows us the % of the total value of housing stock which is mortgaged to an Australia ADI. The chart highlights that the total value of residential housing is substantially higher than the value of outstanding mortgage debt. In March 2017, 22.6% of the total value of housing nationally was outstanding to a domestic ADI. Of course this is only a macro view of the position nationally and individual buyers and individual markets will have dramatically different positions. The analysis is also potentially biased by those that have no housing debt. Recent buyers in particular will in most instances be in nowhere near as strong a position as this indicates, nor will those that purchased at the peak of a market which has since undergone a correction.

Over the 12 months to March 2017, CoreLogic counted 481,106 settled dwelling sales across the country. Based on the 9,858,400 dwellings nationally 4.9% of the total housing stock sold over the year to March 2017. The above chart highlights that over a given year the volume of stock which actually sells is a small proportion of total housing stock. Although the timeseries is unfortunately quite short, at its peak 5.6% of total housing stock transacted over the year to June and September 2014. It should be noted that this is not a perfect measure because off-the-plan sales are not included in the sales data until such time as they settle. When they are settled, the transaction is recorded at the time of the contract which is actually before the property physically existed. Nevertheless, the point remains that a relatively small proportion of housing stock sells over a given year.
Based on the data, the value of residential housing nationally is rising. As the value has risen over recent years an increasing number of households have taken on housing debt however, more than two out of every five properties has no mortgage debt outstanding to Australian ADIs. Although an increasing number of households have taken on housing debt, the value of that debt is rising at a slower pace than the value of housing which is reducing the level of leverage across the market (at a macro level). Finally, a relatively small proportion of housing stock continues to turnover each year. In fact the number of dwelling sales nationally peaked at 630,358 settled sales over the 12 months to September 2003 and the 481,106 sales over the year to March 2017 is -23.7% below the peak which occurred almost 14 years ago.
Source: CoreLogic Feed


