Housing affordability deteriorated further over the March 2017 quarter
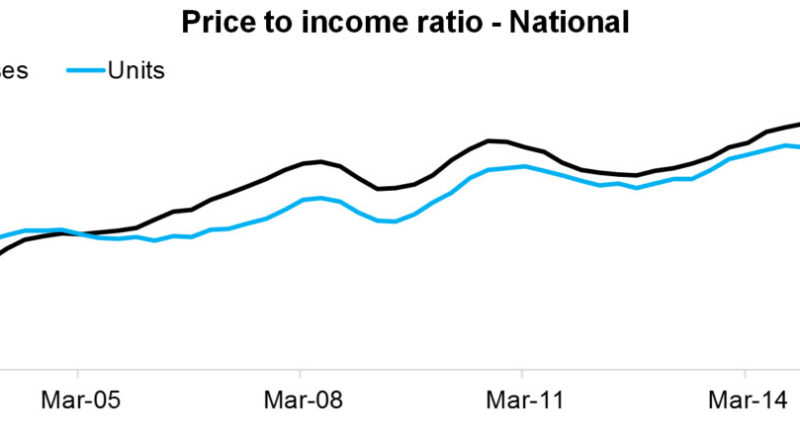
With dwelling values rising at a faster pace than household incomes, housing affordability has worsened over the first quarter of 2017. CoreLogic measures housing affordability across four measures and three of these four measures have seen affordability deteriorate over the quarter.
The four affordability measures that CoreLogic calculate are:
- Dwelling price to household income ratio – essentially how many years of gross annual household income are required to purchase a property outright
- Years to save a deposit – how many years of gross annual household income are required for a 20% deposit
- Serviceability – calculating mortgage repayments on an 80% loan to value ratio (LVR) mortgage utilising the standard variable mortgage rate and a 25 year mortgage, what proportion of gross annual household income is required to service a mortgage
- Dwelling rent to household income – the proportion of gross annual household income required to pay the rent
The measures we look at utilise median household incomes which have been modeled by the Australian National University (ANU).

As at March 2017, the national price to income ratio was recorded at 7.3 compared to 7.2 a year earlier, 6.4 five years earlier and 6.1 a decade ago. Looking at houses and units, the ratios were recorded at 7.4 and 6.7 respectively at March 2017.

It would have taken 1.5 years of gross annual household income for a deposit nationally at the end of the March 2017 quarter. This is compared to 1.4 years a year earlier, 1.3 years five years ago and 1.2 years a decade ago. If saving for a house it would take 1.5 years of the median household income for a deposit compared to 1.3 years of income for a unit.

The calculation of the proportion of household income required to service a mortgage is very sensitive to mortgage rates. At the end of March 2017, the discounted variable mortgage rate for owner occupiers was 4.55% and a mortgage required 38.9% of a household’s income. A year earlier mortgage rates were 4.85% and the mortgage used 39.6% of the household income. Five years ago, mortgage rates were 6.7% and a decade ago they were 7.45% and households required 42.2% and 42.8% of their household income respectively to service a mortgage. Further to this you can see that the proportion of household income required to service a mortgage peaked at 51.0% in June 2008 when mortgage rates were 8.85%. Houses currently require 39.39% of a household’s income to service a mortgage compared to units requiring 36.0%.

The final affordability measure looks at the alternative to taking out a mortgage, renting, looking at the rent to income ratio. The rent to income ratio has been more stable compared with measures related to purchasing a home or servicing a mortgage, as it is more limited by growth in household incomes. In March 2017, the ratio was recorded at 29.6% compared to 30.4% a year earlier, 29.1% five years earlier and 25.8% a decade ago. At the end of March 2017 the ratio was recorded at 29.6% for houses and units.

The above table highlights each of the four housing affordability measures across the Greater Capital City Statistical Areas (GCCSA) regions as at March 2017. Capital cities are generally more expensive across all measures than regional markets despite household incomes generally being higher in capital cities. Sydney is the least affordable housing market across most measures. Sydney’s price to income ratio is significantly higher than all other regions analysed. Furthermore, the serviceability calculation shows that despite mortgage rates being at close to historic low levels, a Sydney property owner is utilising 45% of their household income to service their mortgage.
This data provides a snapshot of how housing affordability is tracking across the country, and it highlights how in Sydney and Melbourne in particular it is deteriorating as dwelling values have risen over recent years. Another important point to note is that lower mortgage rates make servicing debt easier however, it doesn’t make it easier to overcome the deposit hurdle, particularly given fairly sluggish household income growth over recent years. The data also suggests that servicing a mortgage remains more expensive than paying for rental accommodation although the gap has narrowed as interest rates have fallen.
It is important to look at a range of housing affordability measures and analyse them over time to get a true understanding of the housing affordability challenges. Over recent years affordability on a price to income and saving for a deposit basis has deteriorated in Sydney and Melbourne however it is relatively unchanged or slightly improved in most other capital cities. On the other hand, as mortgage rates have fallen servicing a mortgage has required a lower proportion of household income which in turn has allowed some owners to reinvest or increase their spending elsewhere.
Source: CoreLogic Feed


