
Investor borrowing continues to slide but we expect a rebound over the coming months
The April 2016 housing finance data
was released earlier today from the Australian Bureau of Statistics (ABS). Over the month there was $32.0 billion worth of commitments which was the lowest monthly value of housing finance commitments since May 2015.

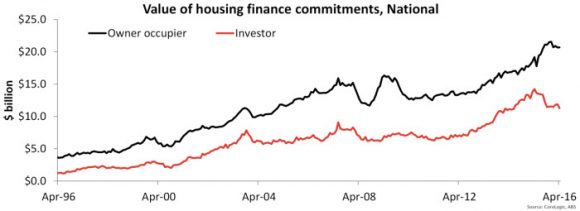
The first chart shows the split between owner occupier and investor lending. Over the month there was $20.7 billion in lending to owner occupiers and $11.3 billion to investors. The value of investor lending over the month was actually the lowest since June 2014. The value of owner occupier housing finance commitments has increased by 0.1% over the month and is 7.8% higher year-on-year. The value of investor housing finance commitments fell by -5.0% in April and are -20.8% lower year-on-year. Importantly, April 2015 was the peak in the value of investor housing finance commitments which indicates the decline since the peak has been significant.

The $20.7 billion worth of owner occupier housing finance commitments consisted of: $1.8 billion for construction of dwellings, $1.0 billion for purchase of new dwellings, $7.3 billion for refinances and $10.6 billion for purchase of established dwellings. Year-on-year the change in the value of lending by type has been recorded at: 1.1% for construction of dwellings,
-5.4% for purchase of new dwellings, 16.3% for refinances and 5.1% for purchase of established dwellings. Refinances currently account for a record-high 35.3% of all owner occupier housing finance commitments.

Investors committed to $11.3 billion worth of housing finance in April 2016 with $1.0 billion worth of commitments for the construction of dwellings and the remaining $10.3 billion for the purchase of established dwellings. Year-on-year the value of lending for construction of dwellings is -1.6% lower while lending for established dwellings is -22.3% lower. There has been a sharp downturn in investor borrowing over the past year as lenders have tightened their policies to slow growth in total investor credit.

With record-high levels of new housing construction it is worthwhile to look at total lending for new housing. In April 2016, $3.8 billion worth of commitments were for new housing which was -13.2% lower over the month and -1.4% lower year-on-year. In terms of new construction commitments as a proportion of total lending, it accounts for 12.0% of new commitments.

The CoreLogic Mortgage Index
which tracks activity across CoreLogic’s proprietary valuation platforms shows that activity moderated in April 2016 (as highlighted by the April 2016 housing finance data). According to the Index, we can expect an uptick in housing finance commitments in May 2016 with the Index rising by 13.9% over the month.
While investor borrowing continues to slide following tighter lending policies over the past year, there are now reports that some lenders are easing these restrictions. Refinancing continues to be a significant driver of owner occupier housing finance commitments. This is reflective of the significant rise in housing equity (particularly in New South Wales and Victoria) and home owners redrawing some of this equity. Furthermore, it is reflective of a competitive mortgage market in which borrowers are shopping around for better deals on their home loans.
Over the coming months we would expect a moderate rebound in demand from the investor segment of the market as lenders relax some of their policies. Furthermore, the mortgage rate cut in early May should also help to encourage renewed demand from the owner occupier segment with interest rates now at their lowest levels since 1968.
Source: Blog Corelogic Feed